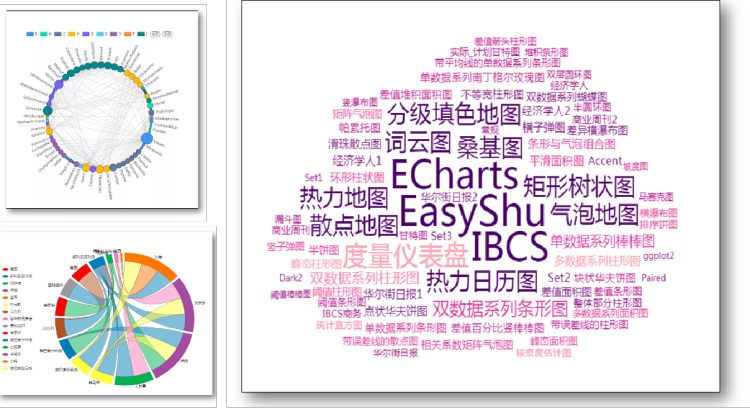
EasyShu is a Microsoft Excel chart professional plugin written in C # language. EasyShu is mainly used for data visualization and analysis. EasyShu 2.2 can now achieve 72 chart types, 30+chart dynamization, 5 different chart styles, 14 different color themes, and provides 10 chart aids.
EasyShu's core chart function mainly includes two modules: business charts and new charts, which can achieve 72 different chart types, from simple single data series bar charts to complex multi data series Nightingale rose charts and correlation matrix charts.

EasShu chart auxiliary functions mainly include chart theme module and auxiliary function module, which can help users better adjust the element format and data form of charts, including position calibration, multi chart tool, chart export, color picker, data thief, data labels and other functions.
Core Chart Functionality
The core chart function of EasyShu mainly includes two modules for new business charts, which can achieve 72 different chart types, from simple single data series bar charts to complex multi data series Nightingale rose charts and correlation matrix charts.
Business Chart Module
This module can be used to draw category and time series charts that are integrated with tables, displaying data under different scenarios, including category comparison, time trend, partial whole, difference comparison, and waterfall composition, totaling 5 types.
After using this module to draw a chart, you can combine 【 Auxiliary Functions 】 - 【 Position Calibration 】 to position the chart deformation within a fixed cell range, so that the table can be aligned and perfectly integrated with the table data.
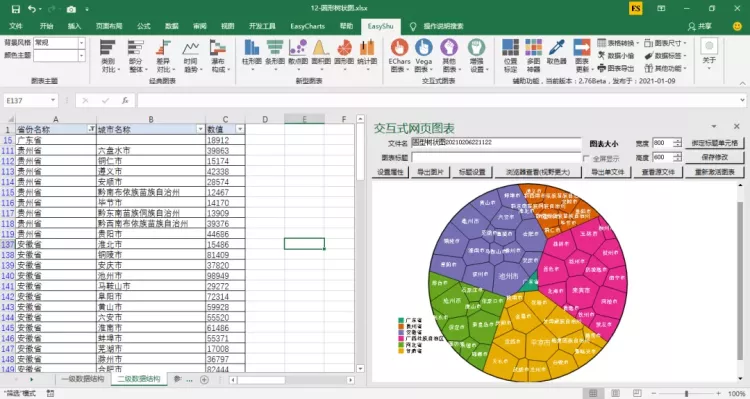
New Chart Module
This module allows you to draw complex types of charts with just one click. The drawing of these charts originally required a large amount of auxiliary data and data calculation in Excel, including six types: bar charts, bar charts, area charts, scatter charts, circular charts, and statistical charts.

Chart Accessibility
The auxiliary functions of charts mainly include the chart theme module and auxiliary function module, which can help users better adjust the element format and data form of charts.
Chart Theme Module
Including two controls: background style and color theme, it can switch the color of the main chart and background style with just one click.
【 Background Style 】 It allows for one click conversion of chart element formats such as chart area color, grid line color and type, coordinate axis label position, etc., but only for charts drawn by the EasyShu plugin, thus achieving chart styles in classic business journals or newspapers such as Business Week, The Wall Street Journal, The Economist, etc;
【 Color Theme 】 Provides 14 color theme schemes, including ggplot2, Set1, Ste2, Set3, Paired, Dark2, Accent, Businessweek, The Wall Street Journal, The Economist, etc., which can be easily converted to Excel with just one click
Auxiliary function module
Including functions such as position calibration, multi graph tool, chart export, color picker, data thief, data tags, etc., it can help users better operate chart elements:
- 【 Position Calibration 】 It can position the deformation of the chart within a fixed cell range, thereby aligning the table and perfectly integrating with the table data;
- 【 Chart Export 】 It is possible to export charts into images of different resolutions and formats, including different image formats such as JPG, TIFF, PNG, BMP, etc;
- The color picker allows users to pick up color values from anywhere on the computer screen and fill the chart graphic area or set text with that color; At the same time, it also provides "color templates" for users to directly use the colors of different color theme schemes;
- [Data Labels] can help users add labels to data series, set their numerical units and formats, and also set the layout format of data labels for pie charts and torus charts, including two ways of arranging labels by tangent and ray positions;
- Data Thief can assist users in extracting data from chart content in images in a semi-automatic manner, thereby obtaining the data series values of the original chart;
- The Multi Chart Tool allows you to draw multiple charts with similar data formats in the form of a split panel, including scatter plots, bar charts, area charts, bar charts, waterfall charts, and many other charts, with the ability to create a visual effect.