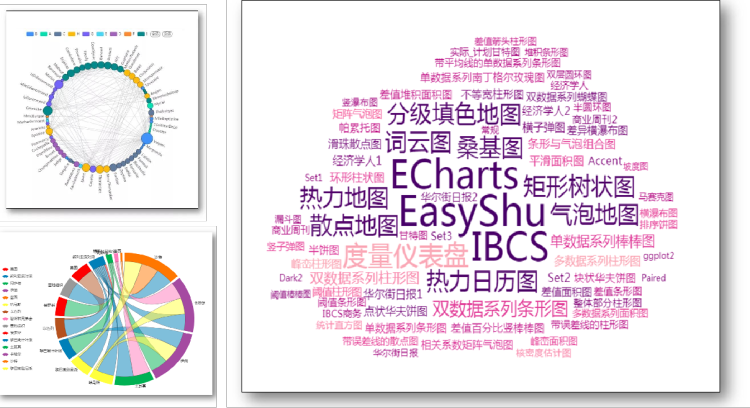
EasyShu is a professional plug-in for Microsoft Excel charts written in C # language. EasyShu is mainly used for data visualization and data analysis. EasyShu 2.2 can already achieve 72 chart types, 30+chart dynamics, 5 different chart styles, 14 different color themes, and provides 10 chart auxiliary tools.

EasyShu's core chart function mainly includes two modules: business charts and new charts, which can achieve 72 different chart types, from simple single data series bar charts to complex multi data series Nightingale rose charts and correlation coefficient matrix charts.
EasShu chart auxiliary functions mainly include chart theme module and auxiliary function module, which can help users better adjust the element format and data format of charts, including position calibration, multi chart artifact, chart export, color picker, data thief, data labels, and other functions.
Core Chart Functionality
EasyShu's core chart functions mainly include two new business chart modules, which can implement 72 different chart types, from simple single data series bar charts to complex multi data series Nightingale rose charts and correlation coefficient matrix charts.
Business Chart Module
This module can be used to draw category and time series charts that are integrated with tables, displaying data under different scenarios, including category comparison, time trend, partial whole, difference comparison, and waterfall composition, totaling 5 types.
After using this module to draw a chart, it can be combined with [Auxiliary Functions] - [Position Calibration] to position the deformation of the chart within a fixed cell range, allowing for alignment of the table and perfect integration with the table data.
New Chart Module
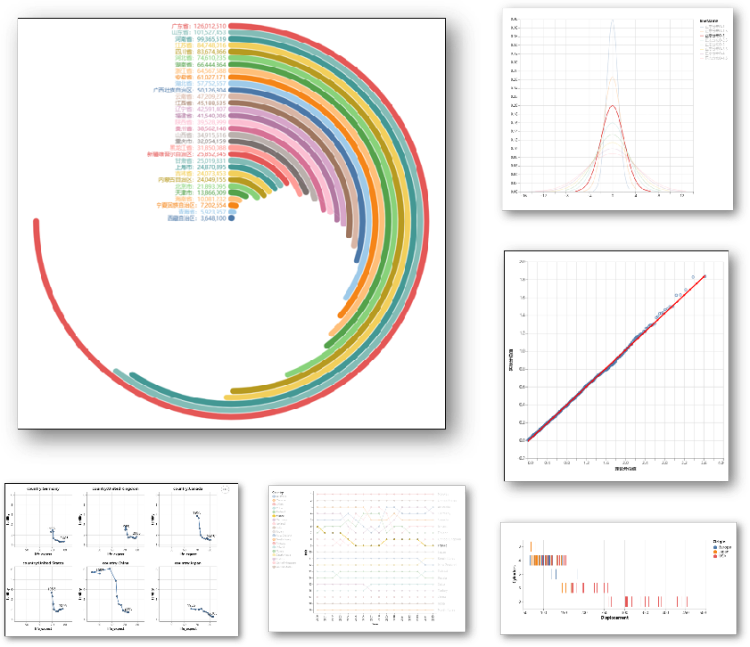
Using this module, you can draw complex types of charts with one key. These charts can be drawn only by using a large amount of auxiliary data and data calculation in Excel, including six types: column chart, bar chart, area chart, scatter chart, ring chart, and statistical chart.
Chart Accessibility
The auxiliary functions of charts mainly include the chart theme module and auxiliary function module, which can help users better adjust the element format, data format, etc. of charts.
Chart Theme Module
It includes two controls: background style and color theme, which can switch between the main color chart and background style with one click.
【 Background Style 】 It is possible to convert the chart area color, grid line color and type, coordinate axis label position, and other chart element formats of the chart with one click, but only for charts drawn by EasyShu plugin, thus achieving the chart style on classic business journals or newspapers such as Business Week, Wall Street Journal, and The Economist;
【 Color Theme 】 provides 14 color theme schemes, including ggplot2, Set1, Ste2, Set3, Paired, Dark2, Accent, Business Week, The Wall Street Journal, The Economist, etc., which can be converted to Excel with one click
Auxiliary function module
Including functions such as position calibration, multi graph artifact, chart export, color picker, data thief, and data labels, it can help users better manipulate chart elements:
- 【 Position calibration 】 can position the deformation of the chart within a fixed cell area, allowing for alignment of the table and perfect integration with the table data;
- 【 Chart Export 】 You can export charts into images of different resolutions and formats, including different image formats such as jpg, tiff, png, bmp, etc;
- The color picker allows users to pick up color values from anywhere on the computer screen, and can fill the graph area or set text with that color; At the same time, it also provides "color templates" for users to directly use the colors of different color theme schemes;
- [Data Labels] can help users add labels to data series, set their numerical units and formats, and also set the layout format of data labels for pie charts and doughnuts, including two methods of arranging labels according to their tangent and radial positions;
- Data Thief can help users directly extract data from chart content in images in a semi-automatic manner, thereby obtaining the data series values of the original chart;
- [Multi graph artifact] It can draw multiple charts with similar data format by one key in the form of plane splitting, including scatter chart, column chart, area chart, bar chart, waterfall chart and many other charts, and its renderings.